Map the portfolio
Add operating and planned assets with core characteristics.
Compare assets, local markets and routes to revenue across operating and planned capacity.
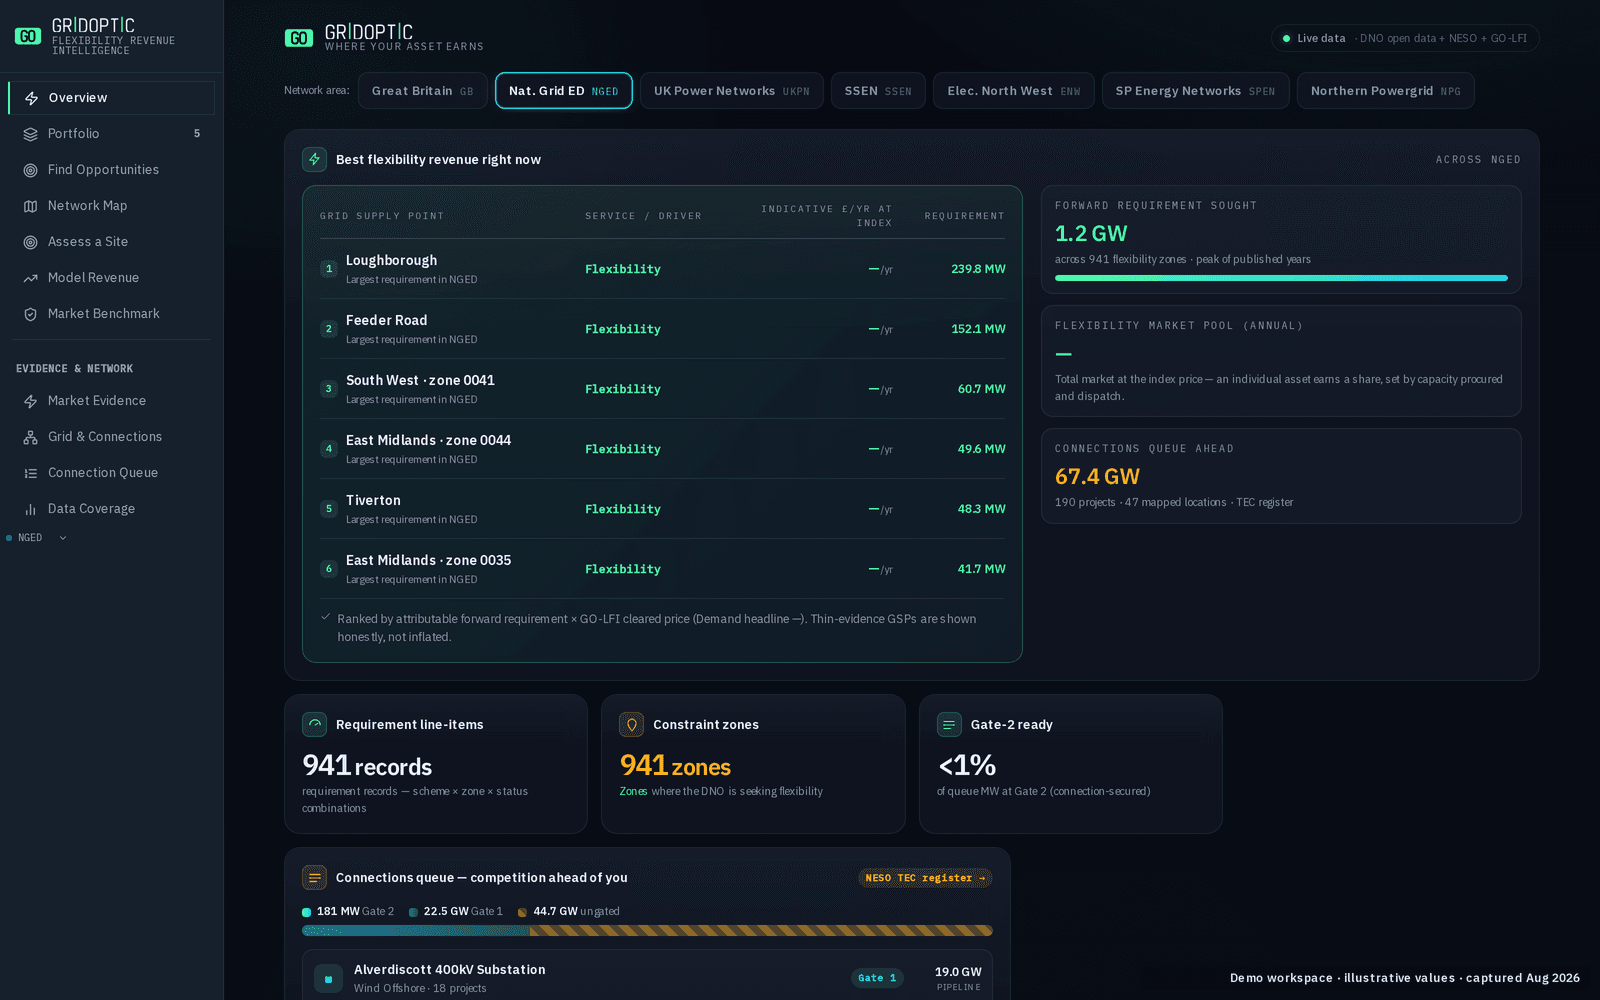
The GridOptic interface, captured from a demo workspace. Network and location names are real; every figure shown is illustrative and does not reflect live data.
GridOptic connects asset characteristics to observed local procurement, helping owners prioritise where commercial effort can produce the strongest return.
Screen every asset on common measures
Find relevant local flexibility markets
Benchmark potential with GO-LFI
Track evidence changes over time
Add operating and planned assets with core characteristics.
Connect each asset to local services and market evidence.
Focus commercial teams on the strongest evidence-rated cases.
Bring a postcode, coordinates, GSP or portfolio. We will show you what GridOptic can resolve.